Publication of new views#
As described above, there are currently 4 types of views in MapX which all have particularities in their publishing process. In this section, the publishing process is described in detail for vector views and then the specifics of raster and custom codes views will be discussed. Story maps are covered in a dedicated chapter.
Remember that publishing (and editing) views is limited to publishers and administrators.
Vector views#
Creating a new view#
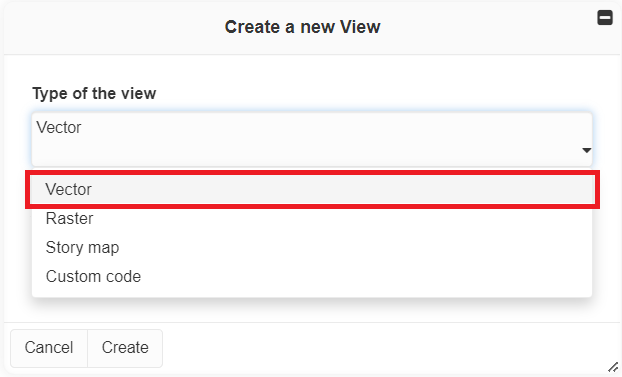
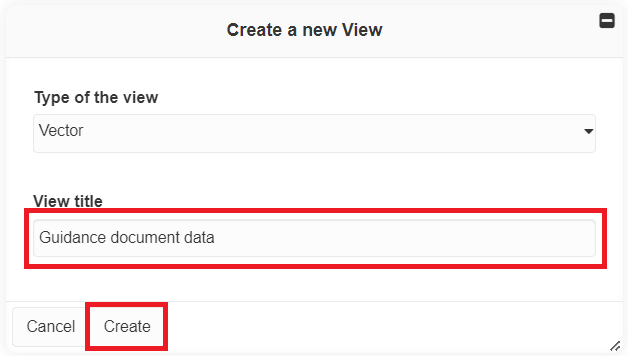
To add a view, click on Create a new view from the Toolbox.
In the panel:
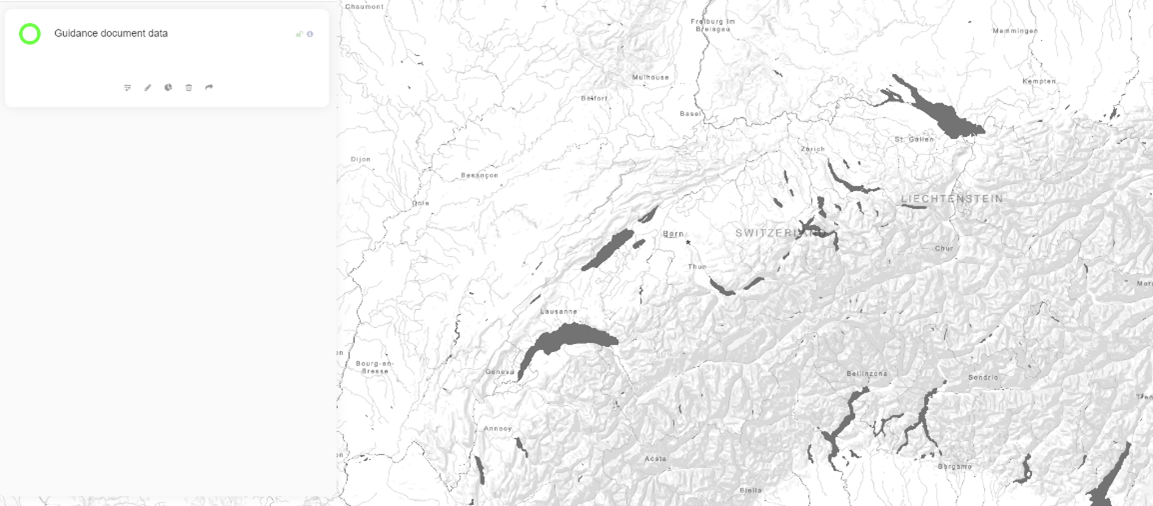
The new view is now available in the left panel but it is empty.
configuring a view#
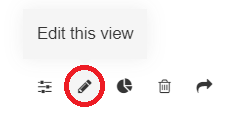
To configure a vector view, click on it and then click on Edit this view:
A configuration panel appears, fill out the form and once it is done, click on Save.
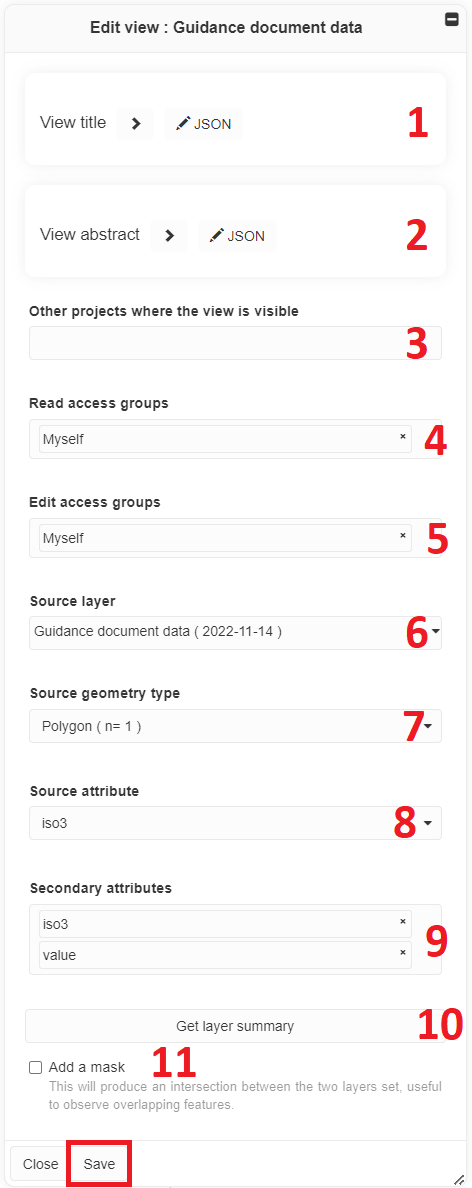
View title [multilingual]
Small description of your view (data, source, etc.) [multilingual]
Select other projects where the view will be visible. The view will not be editable from these projects.
Define who can access this view in MapX
Define who can edit this view in MapX
Select the source layer from the database
Type of geometry (cannot be changed)
Select the source attribute to display in the view
Select secondary attribute(s) to be displayed in the pop-up and in the attribute table, and/or used in the dashboard
Get layer summary
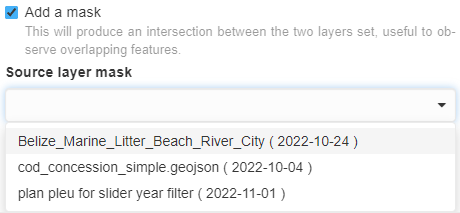
Add a mask to the view. This will produce an intersection between the two data sources (useful to observe overlapping features).
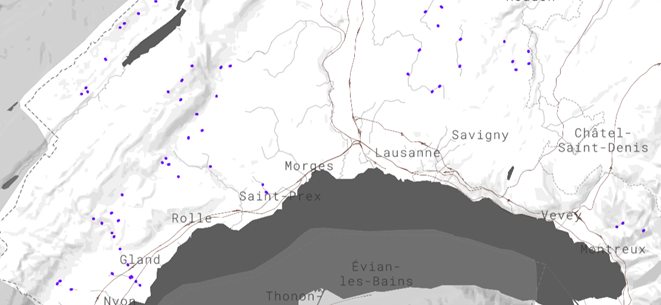
The view is now configured. The selected source variable is displayed on the map when the view is activated but no style has been defined.
Creating a style#
To create a style for a vector view, click on Set the style of this view:
A configuration panel appears, fill out the form and once it is done, click on Save.
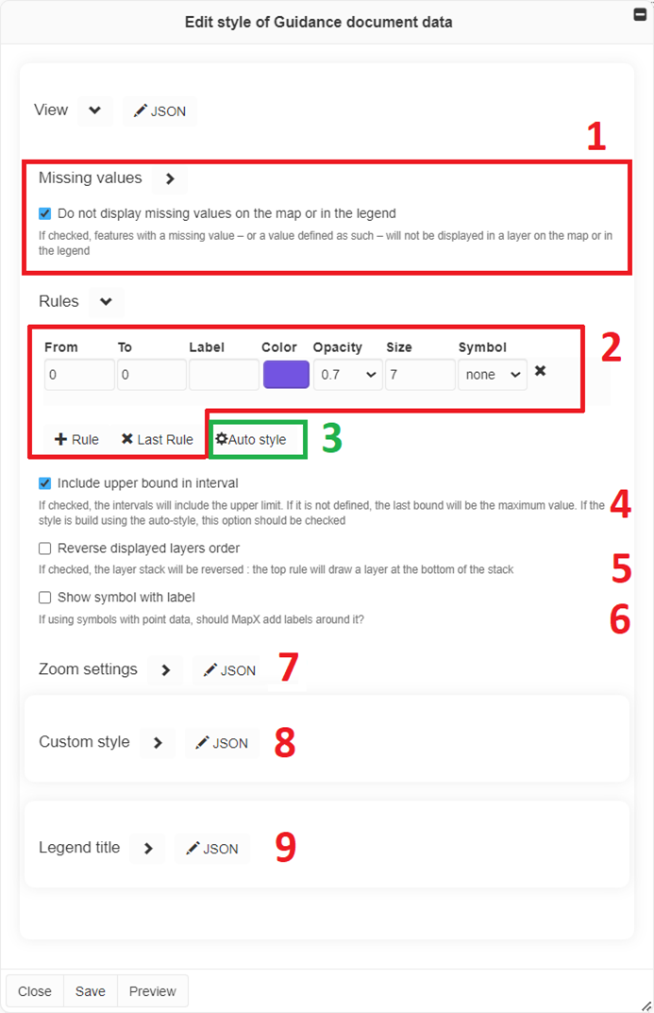
Missing values: rule allowing to style NA/null value.
Rules to classify the data displayed in the map can be set manually:
+Rule: add a class in the legend.Value: values defining the intervals of each class.
Label: labels will be displayed in the view’s legend in the left panel.
Color, opacity & size: each class can be set independently of each other.
Symbol: additional symbol can be added to each class feature.
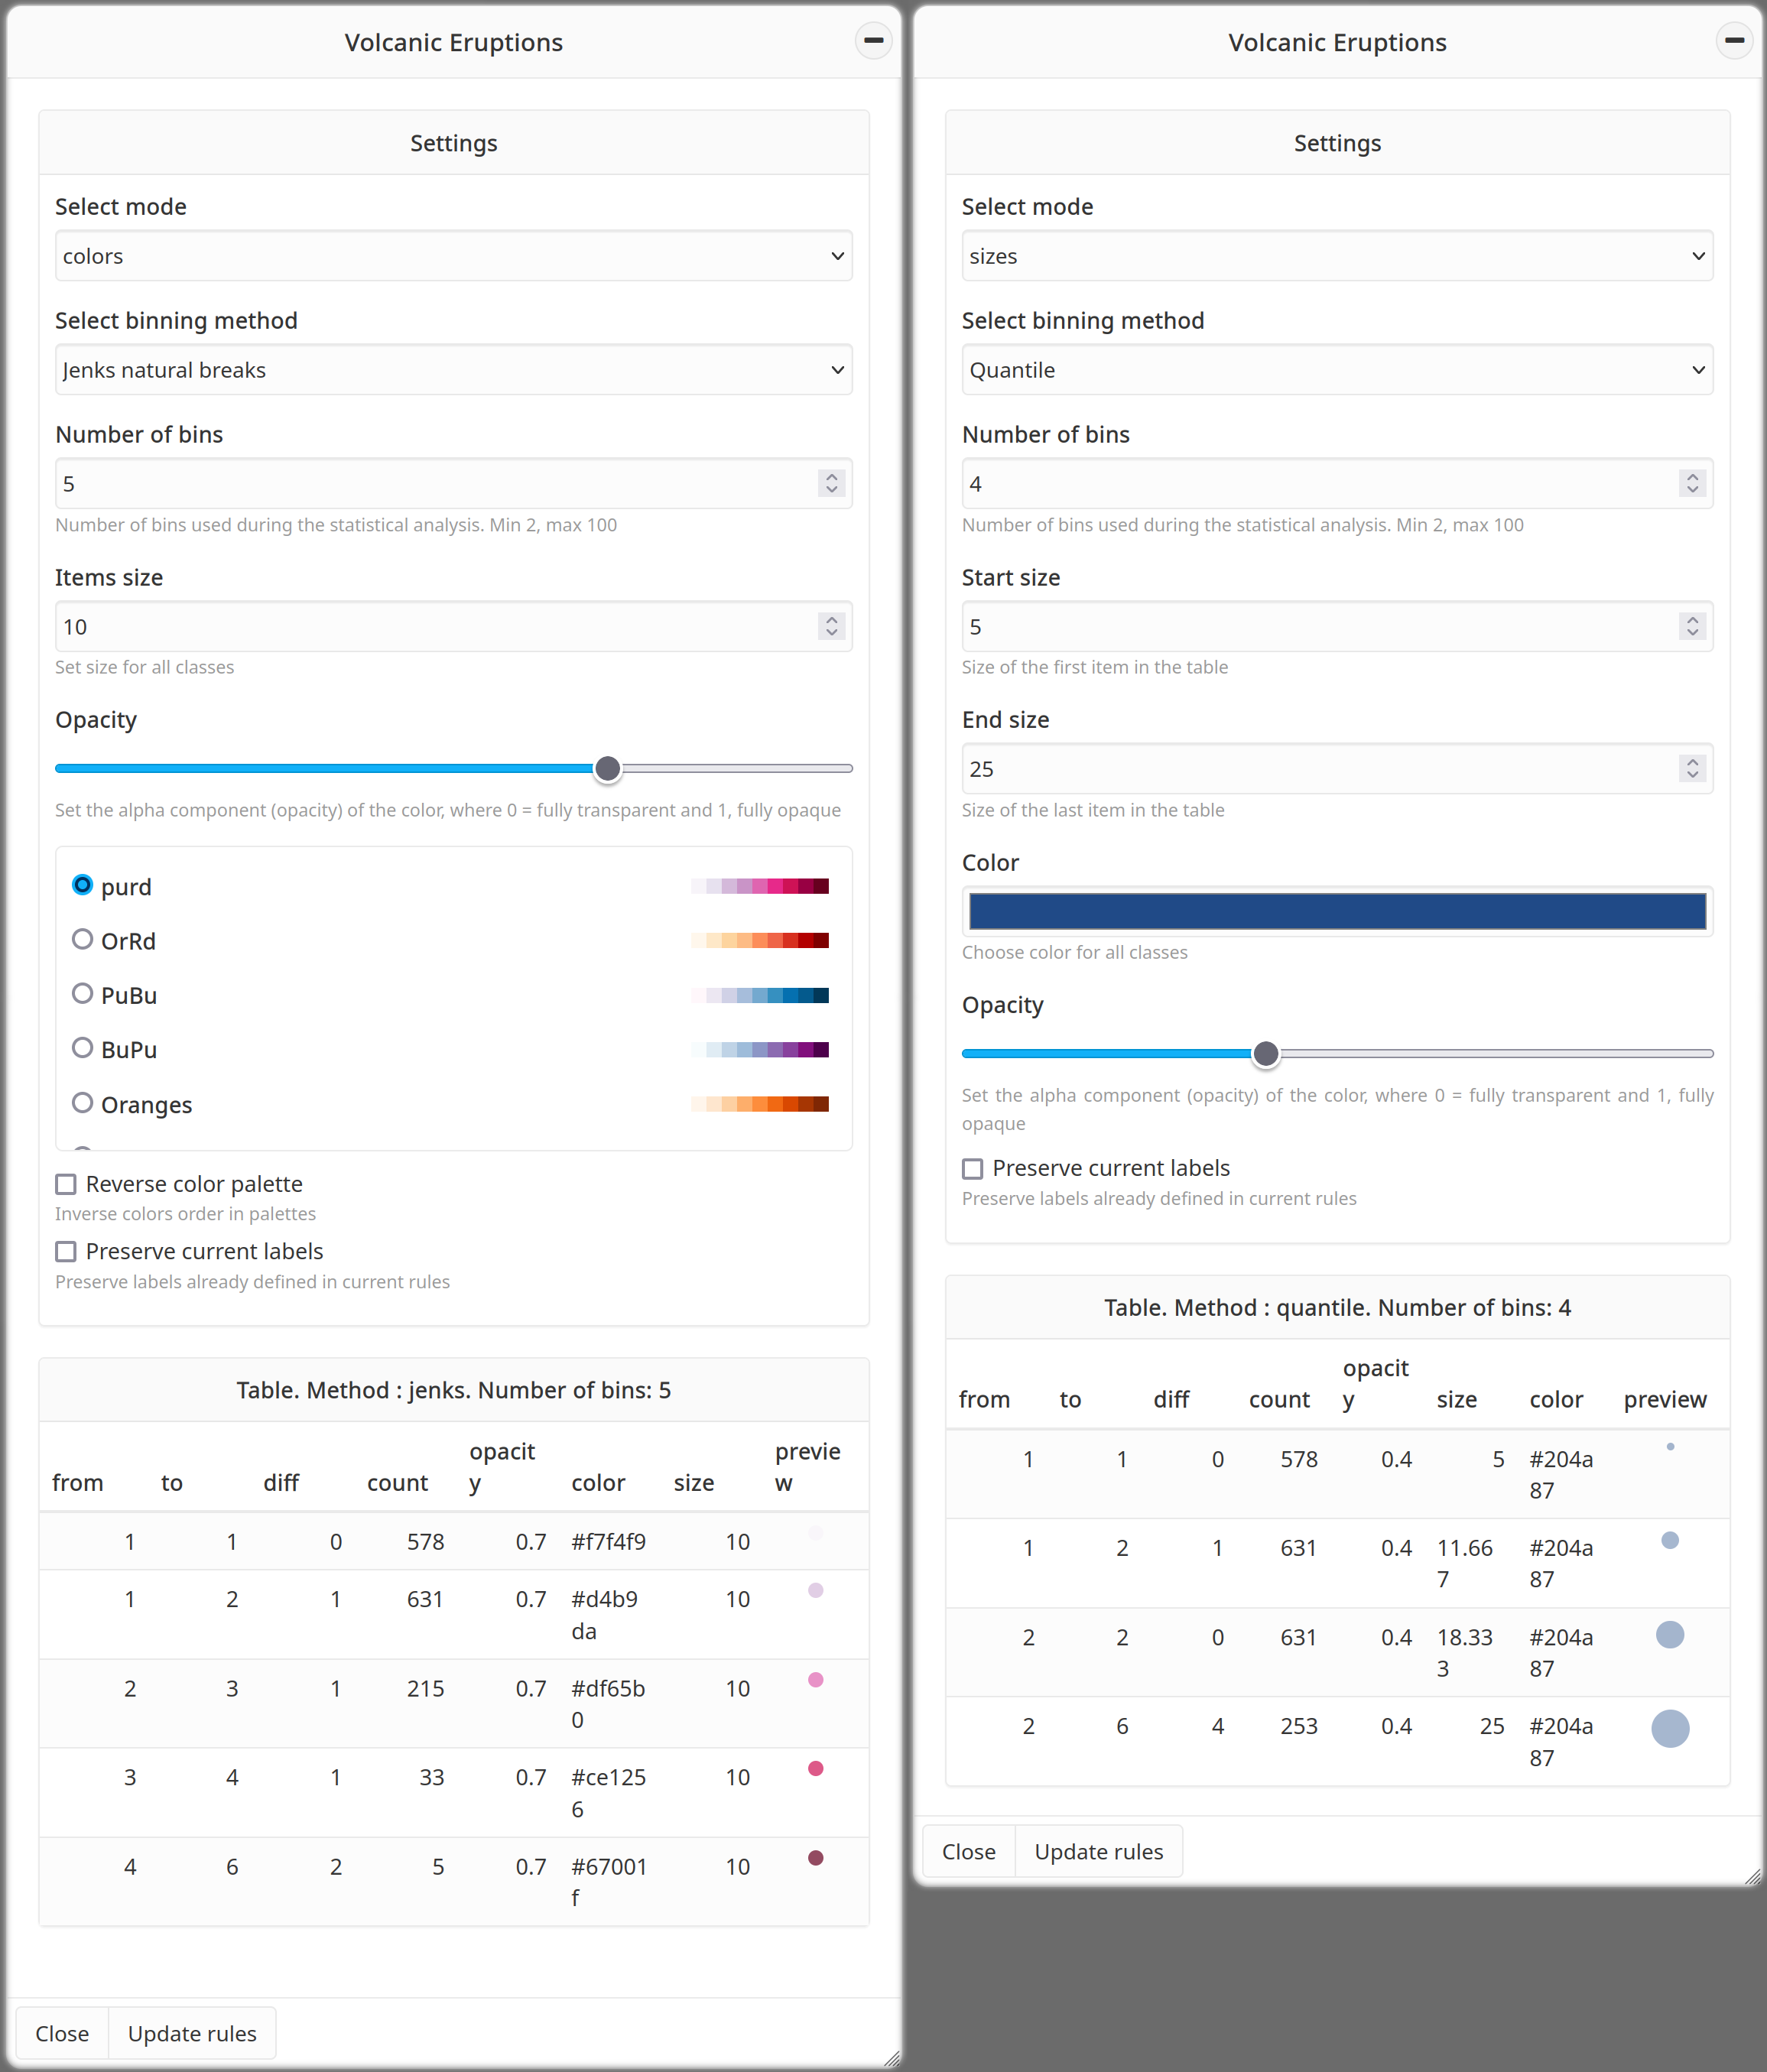
The Auto style tool automatically classifies data according to a Number of bins and Binning method (user-defined). Two visualization modes are available:
Colors: a color ramp is selected by the user and from this, a color is assigned to each class automatically. In addition, it is possible to define a size (points and lines only) and an opacity which will be attributed to all classes.
Sizes: a size is automatically calculated for each class between a start and end value defined by the user. In addition, it is possible to define a color and an opacity which will be attributed to all classes.
A click on Update rules transfers all generated rules to the main Edit style panel.
Tip
Classification methods:
Equal interval divides the range of values into equal-sized classes. MapX determines automatically where the breaks should be depending on the number of classes you specified. This type of classification is best used for continuous data such as precipitation or temperature.
Quantile divides the range of values into classes containing an equal number of features. It is best used for data that is evenly distributed across its range.
Natural breaks (Jenks) generates classes based on natural groupings inherent in the data. Breaks are calculated in a way that best groups similar values together and maximizes the differences between classes. It is best used for data that is unevenly distributed but not skewed toward either end of the distribution.
Head/tail breaks is a classification scheme for grouping data with a heavy-tailed distribution that is characterized by a majority of small values in the tail and a minority of large values in the head (i.e., heavily right skewed). Heavy tailed distributions are commonly characterized by a power law, a lognormal or an exponential function.
For more information and examples, see the sources on which these explanations are based:
Essentials of Geographic Information Systems v1.0 by Saylor Academy
Head/tail breaks on Wikipedia
Include upper bound in interval: if checked, the intervals will include the upper bound. Whatever option is selected, the minimum and maximum value are always included in the first and last intervals.
Reverse displayed layers order: if checked, the layer stack will be reversed (the top rule will draw a layer at the bottom of the stack).
Show symbol with label: if using symbols with point data, should MapX add labels around it?
Zoom settings: option to vary the size of the points according to the zoom level.
Custom style (advanced users - requires knowledge of Mapbox style specifications): creating a style by directly editing the view code. More information in Mapbox documentation.
Legend title [multilingual]: title you want to give the legend.
Once the style is defined, it will be applied to the layer automatically when it is consulted from the data catalog.
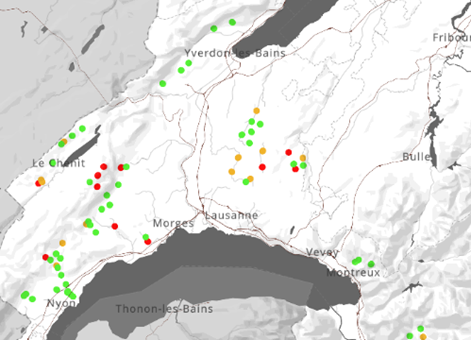
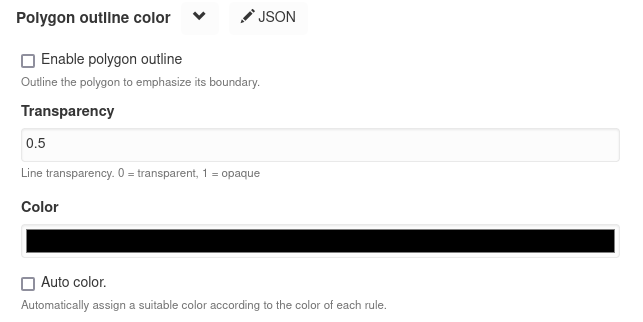
If the vector view contains polygon type features, an additional option is present in the Edit style panel which allows to (de)activate and configure an outline (applied to every rule defined in the style).
Raster views#
Unlike vector views which displays data published in the MapX database, raster views can only display data from external sources. They support Web Map Service (WMS) and Web Map Tile Service (WMTS) protocols from platforms that comply with the Open GeoConsortium (OGC) Standards. Their configuration differs a little from that of vector views:
the external data source and the source metadata are defined from the view’s configuration panel.
the style of the layer and the legend are defined by the data provider and not in MapX.
After having created a new raster view, publishers can use the additional fields in the configuration panel to set up the data source and to fill the metadata.
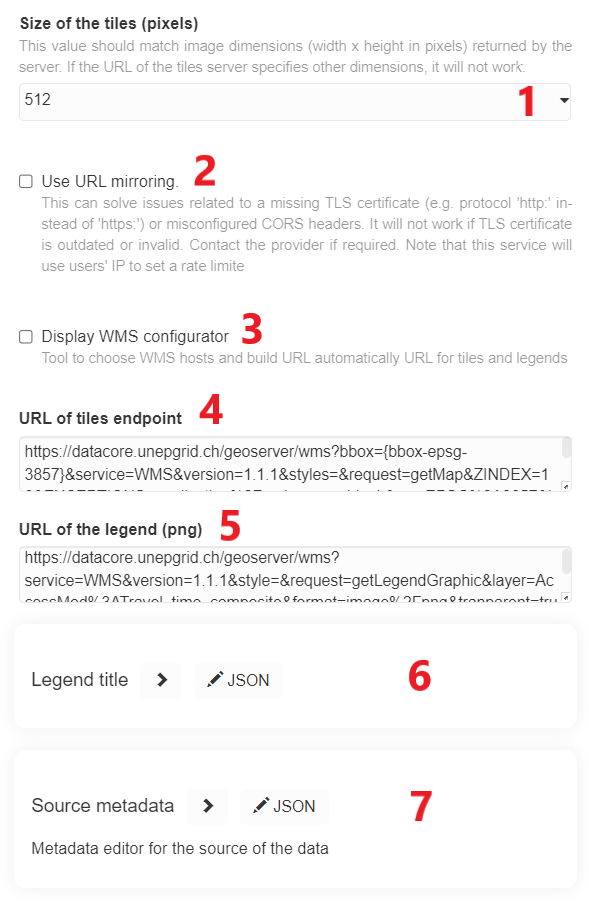
Size of the tiles: this value should match image dimensions (width x height in pixels) returned by the server. If the URL of the tiles server specifies other dimensions, it will not work.
Use URL mirroring: as MapX requires an https connection with CORS enabled to fetch external content, this option can be activated to solve issues related to a missing TLS certificate (e.g.,
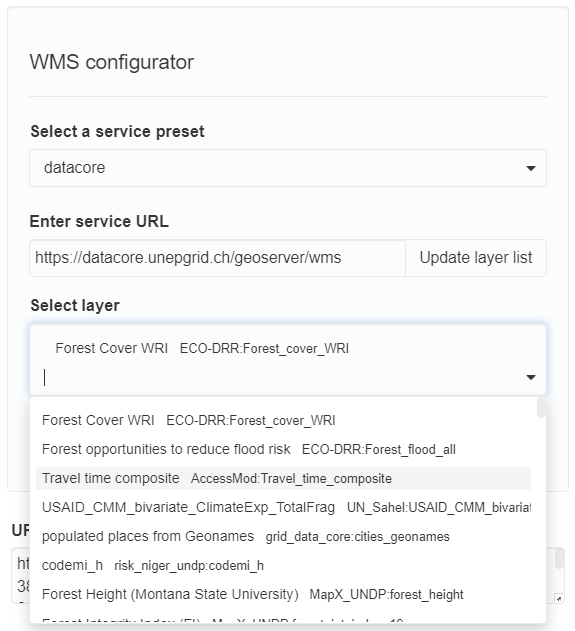
httpprotocol instead ofhttps) or misconfigured CORS headers. It will not work if TLS certificate is outdated or invalid.Display WMS configurator: this tool allows to automatically build tiles and legend URLs for a WMS endpoint. Publishers can choose from a drop-down list of predefined endpoints or manually enter a WMS endpoint to get the list of available layers. Once the layer to be published in MapX has been selected, a click on the Update generated URL button will automatically generate the queries to fetch the tiles and the legend from the service. As for WMTS, the WMS configurator does not support this type of service. Queries must be entered manually in the dedicated fields.
URL of tiles endpoint: query to fetch the tiles (WMS/WMTS).
URL of the legend: query to fetch the legend. Please note that only the PNG format is supported.
Legend title [multilingual]: legend title to display in the view catalog.
Source metadata: since 2021, users can describe the view using the complete MapX metadata template (see Metadata) within the raster view configuration panel. A link to download the data source can be provided in the Source section of the metadata template.
Custom code views#
To have a larger spectrum of solutions when creating a view, MapX allows developers (more details here) to code a view and thus customize it to their needs. Custom code views allow, among other things, to publish external data (raster and/or vector), to integrate advanced features such as sliders and/or drop-down lists or even to interact with the map (e.g., zoom in on specific areas). The development of this type of view is reserved for advanced users as it requires knowledge of JavaScript, HTML, CSS and the Mapbox library.
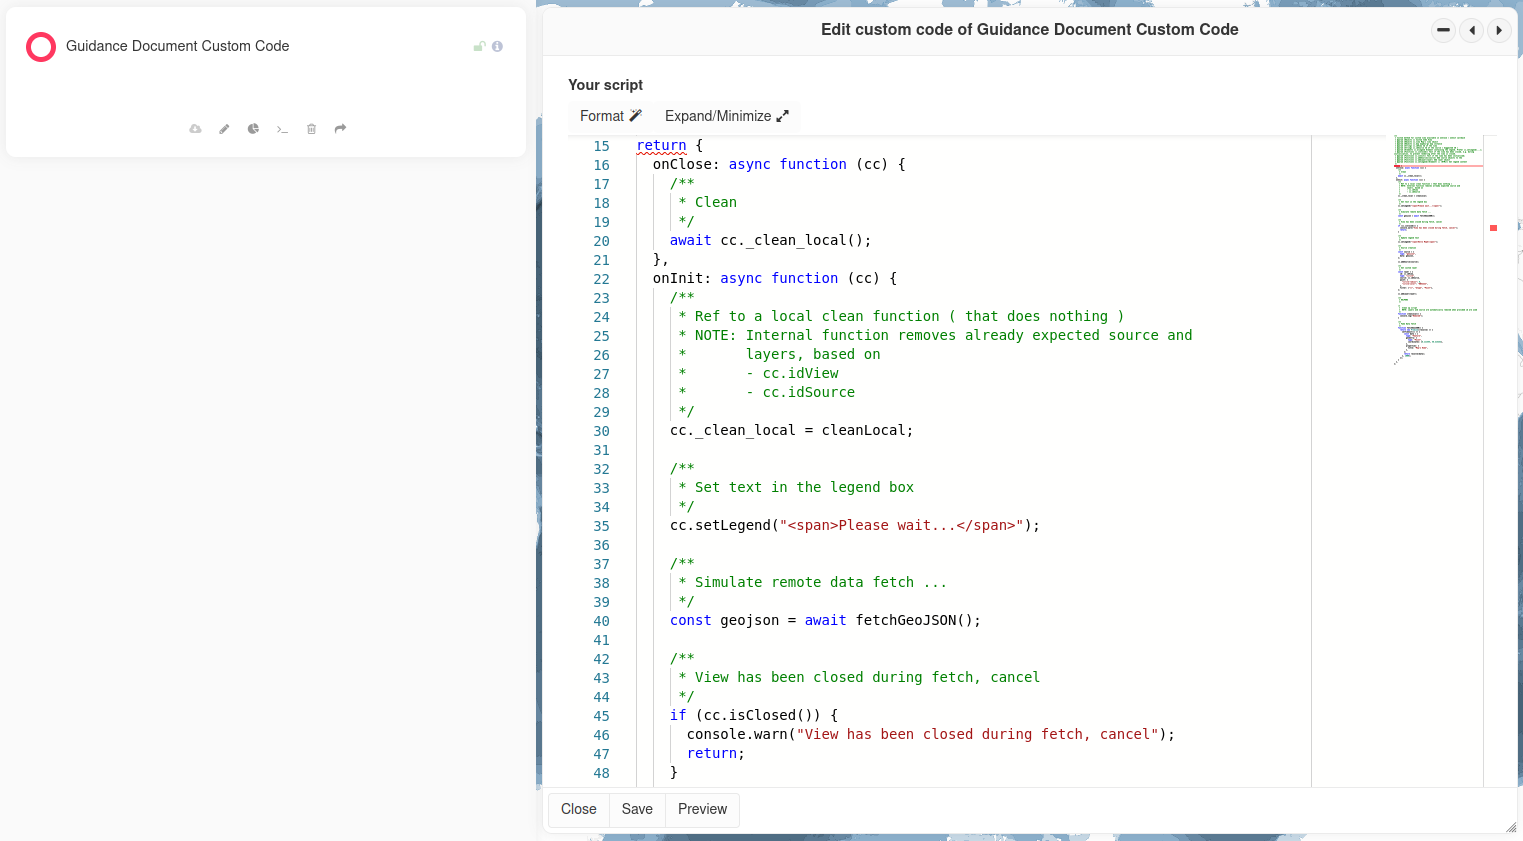
As it is for raster views, users can describe the view using the complete MapX metadata template (see Metadata) within the custom code view configuration panel.
If you are interested in developing your own custom code views, please contact the MapX team at: info@mapx.org .
