Creating a story map#
To prepare your story map, we recommend creating what is known as a storyboard to plan your story map before developing it on the platform. With each step you should know what the content will include: a title, text, picture, video, and/or spatial data. Before embarking on the implementation of your story map, make sure that all geospatial data is available in MapX and that you have collected and prepared all supporting media (i.e., photos, infographics, videos). An example of a storyboard is available here and its implementation in MapX here .
Glossary#
Here are the specific terms you will find in the story map editing tool:
Step: the steps of your story map are what appears on the screen. These are equivalent to “chapters” of your story: when the first chapter is over, create another by adding a new step.
Slide: a slide is the box containing the text or images you see on your screen. You can show different slides one your screen, meaning you can add different slides to each step.
Class: the class is the parameter given to your slide. It determines the position of your slides on the screen, the level of transparency, etc.
Creating a story map view#
Story maps are a special type of view in MapX. Their creation and configuration is similar to that of vector views which is described in detail in Publication of new views. Please refer to this chapter for full details.
Adding content to a story map#
Once you have created and configured your story map (view), you can start designing/implementing its content.
To edit the content of your story map, click on the Edit story map button in the view tools. This will open the main menu to edit the story.
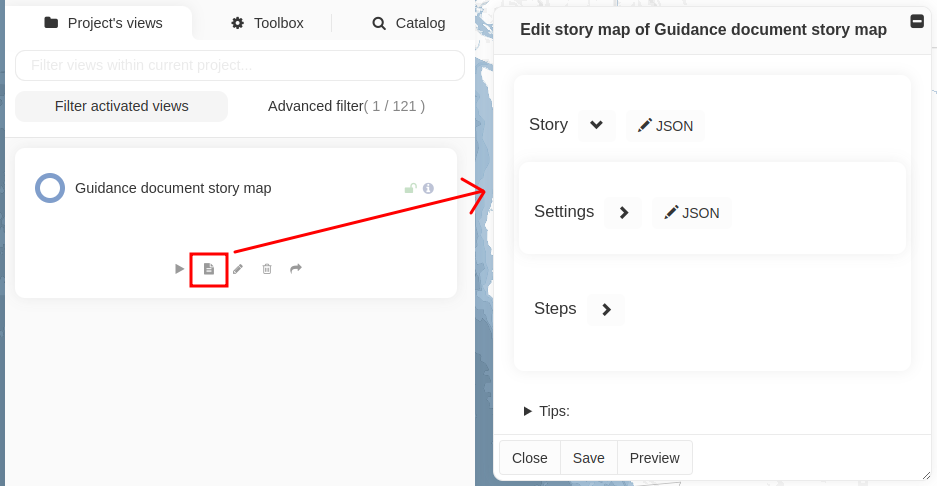
Access to the story map editing tool#
From here on, this guide will take you step by step through all of all the tools at your disposal to design the content of the story map.
Defining the settings of a story map#
First, you should define the settings that will apply to the whole story
map by clicking on the arrow > to expend the Settings section:
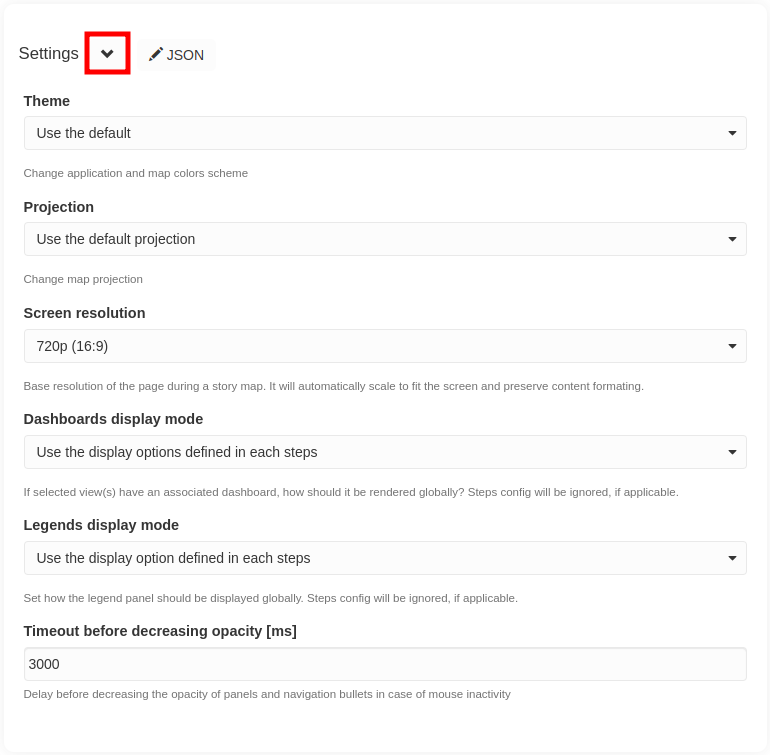
Global story map settings#
Theme: change application and map colors scheme (the default theme in MapX is Classic light)
Projection: change map projection (the default projection in MapX is Web Mercator)
Screen resolution: resolution of the page during reading. It will automatically scale to fit the screen and preserve content formatting. The default parameters of the screen resolution are automatically set on 720p (16:9). The most used screen resolution is 720p and 1080p.
Dashboards display mode: if view(s) in the story map have an associated dashboard, this setting allows to define how they will be rendered (i.e., open, closed or hidden). This setting applies to the whole story map, but it can be overwritten at each step if necessary.
Legends display mode: set how the legend panel should be displayed in the story map (i.e., open or closed). This setting applies to the whole story map, but it can be overwritten at each step if necessary.
Timeout before decreasing opacity [ms]: delay before decreasing the opacity of panels (i.e., legends, dashboards, pop-ups) and the menu bar in case of mouse inactivity.
Creating a step#
The step is the space containing your narrative, your pictures, etc. that support the map. It is basically a chapter of your story map (similar to the slide concept in PowerPoint). Typically, a story map has between 15 and 20 steps. To create a complete story map, you will have to repeat the operations described in the sections below for each of them.
To create/add a new step, click on the + Step button. Once the step
is created, you can expand its editing section by clicking on the >
arrow.
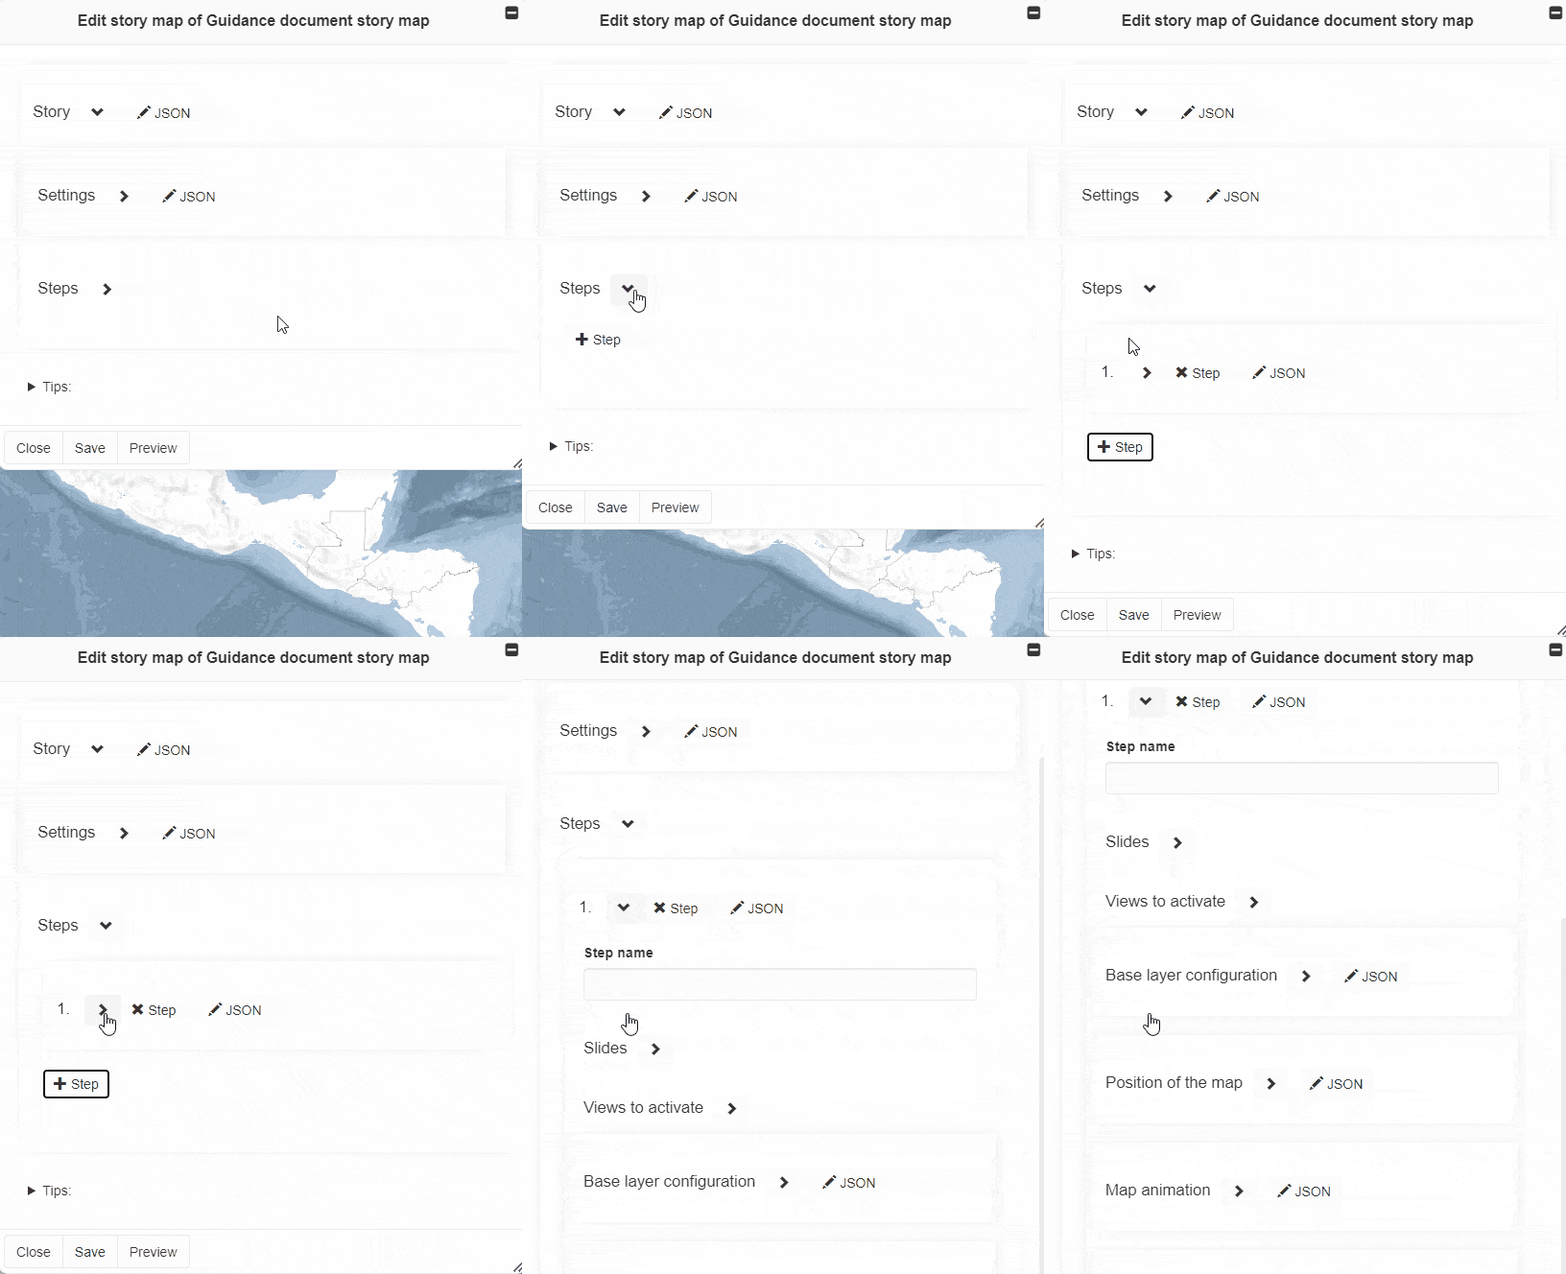
Creating a step#
Here is a brief overview of the different tools you will find in the step editing section some of which are detailed in dedicated subsections that you will find further down this page.
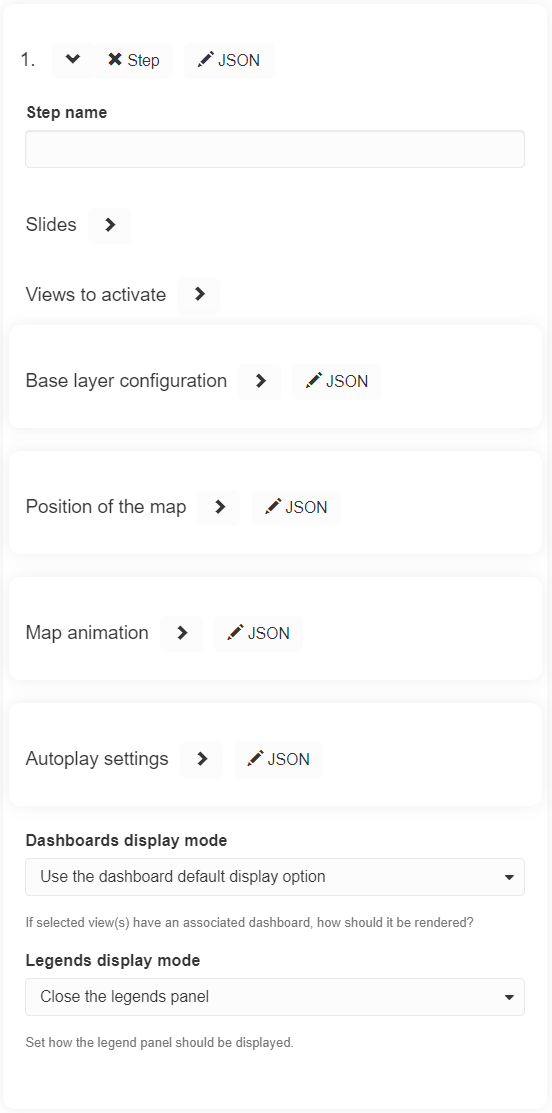
Step editing section#
Step name: set a title to the step to keep your story map organized. Titles can be edited at any time. As a story map typically has 15-20 steps, finding the step you want to edit becomes easier and will allow the reader to know where they are in your story. You can move your steps around by clicking the up and down arrows beneath each step title.
Slides: add a slide to the step. Slides are boxes where media (e.g., photo, video) and text elements can be added to the current step of the story map.
Views to activate: add data on the map.
Base layer configuration: add a high-resolution aerial imagery to the map and/or to enable the 3d terrain mode which make elevation appears in 3 dimensions. The 3d terrain mode renders well at high zoom, with the camera tilted.
Position of the map: set the position of the map for a given step. Either manually enter the center coordinates and zoom of the map or (recommended) use the Update using current map parameter to automatically set the map according to its current position. This determines what geographic area is displayed on the map.
Map animation: set the way of transitioning from one step to the next step of the story map.
Autoplay settings: define how the step will be played when the story map is consulted in autoplay mode (triggered by pressing the spacebar), in particular the time during which the step is displayed.
Dashboards display mode and Legends display mode: override the global options set in the story map settings.
Note
Remember to regularly save your draft story map by clicking on the Save button located at the bottom of the story map editor.
The Preview button lets you see what the story map will look like. This is especially useful when experimenting with different design solutions for the content you want to display.
Creating a slide#
By creating slides (the building blocks of a step), you add content into the step of the story map. It is recommended to add one slide per content (e.g., title, text, photo, video, etc.).
To add a new slide, expand the Slide section by clicking on >
arrow and then click on the + Slide button.
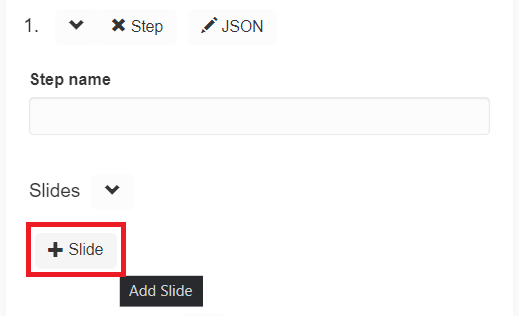
Creating a slide#
To stay organized, title your slide immediately after creating it (e.g., slide 1: photo; slide 2: text; etc.).
It is possible to add content to the slide in HTML format directly from the Content section but we recommend that you do not do so. A more interactive method for adding text, image or video is available and described below. Before adding content interactively, we recommend that you configure the step as follows:
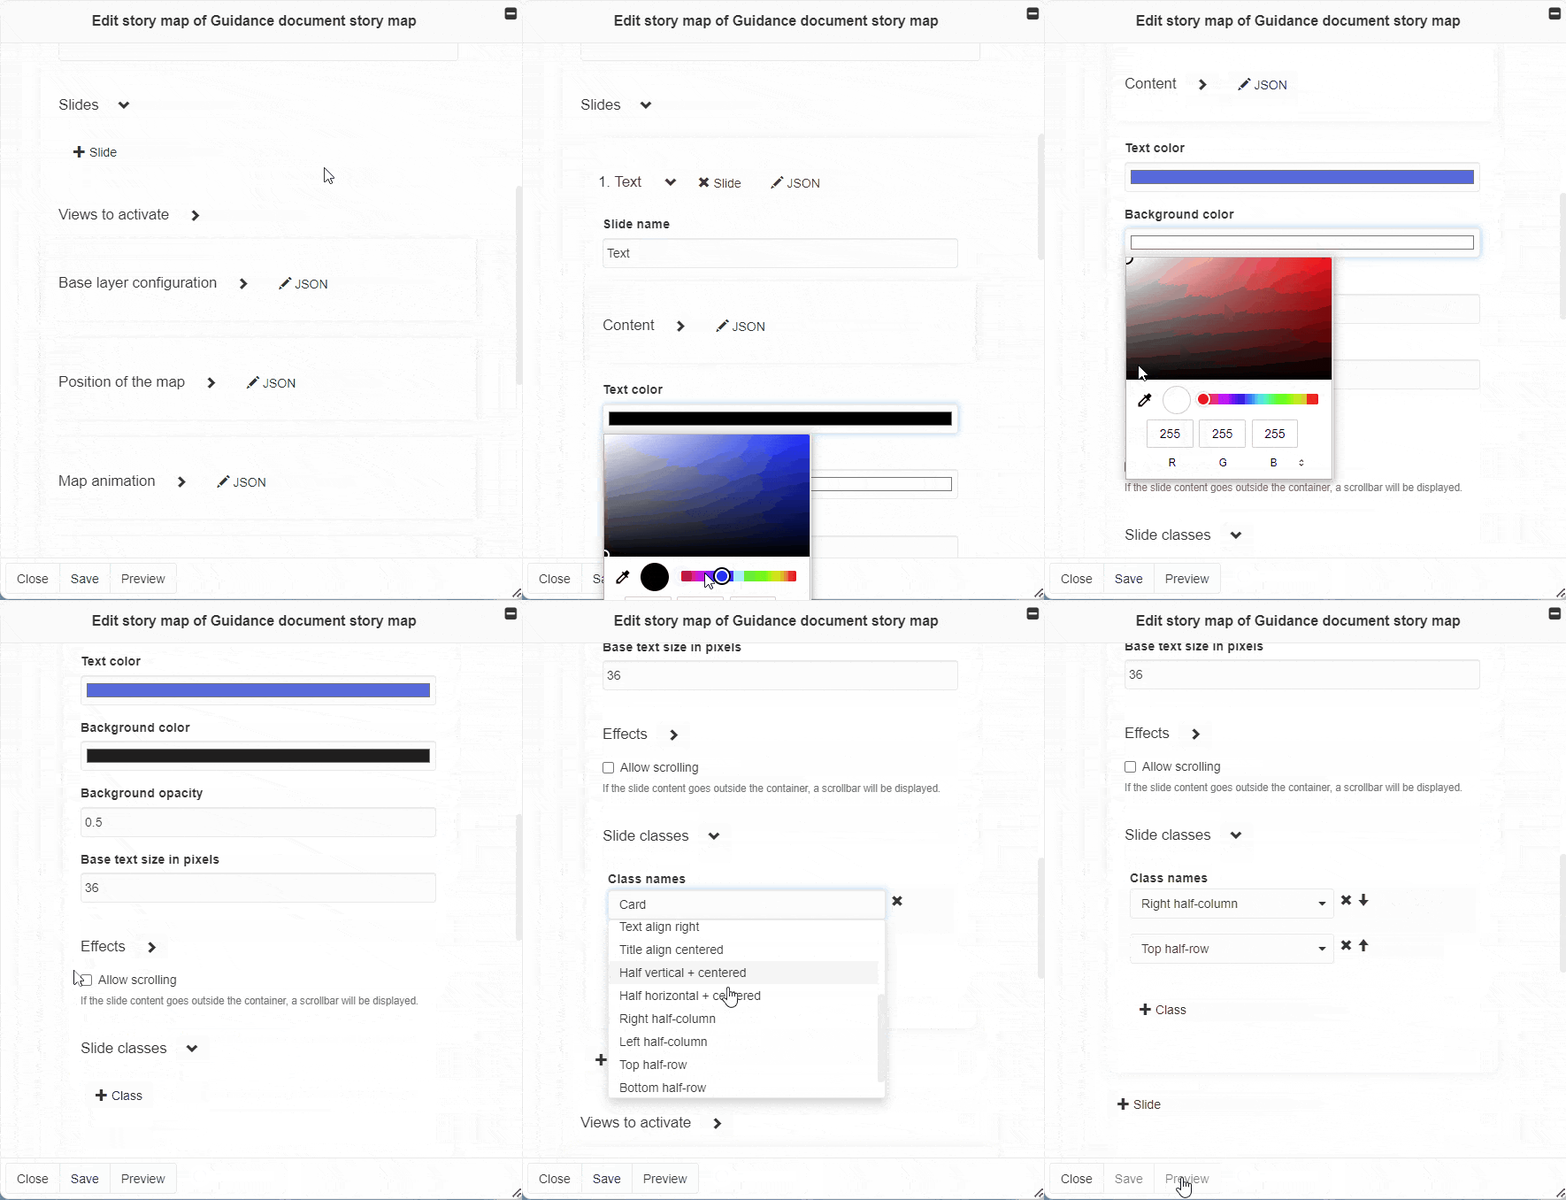
Text color: click on the color bar to choose the color to be applied to the text.
Background color: click on the color bar to choose the color to be applied to the background of the slide.
Background opacity: click on the number in the box and define manually the opacity between 0 and 1. NB: 0 is totally transparent and 1 is totally opaque.
Base text size in pixels: click on the text size number in the box and define manually the size of the text.
Effects: this section allows you to configure parallax effect(s) on the slide. This is an advanced option that is not widely used in MapX and therfore, not covered in detail in this document.
Allow scrolling: enable this option if the slide content goes outside the container. A scrollbar will be displayed automatically.
Slide classes: click on this section to define the positioning of your slide using the pre-configured classes. Classes can be combined (e.g.,
half-top / half-bottom+half-left / half-rightto place the slide in the quadrant of your choice).
Hint
Photos look good when either placed in one of the quadrants or as a full-size image in the background.
Full screen titles look good with e.g., the
half-horizontal-centerclass for the text and a full-size image in the background.Adding the
image-coverclass to the slide means that if you insert a photo, it will be displayed over the whole slide defined by the other classes. You can change the order of the image in the slide so that text is displayed on top using the arrows next to the slide number.The
textclasses define the alignment of the text within the slide.
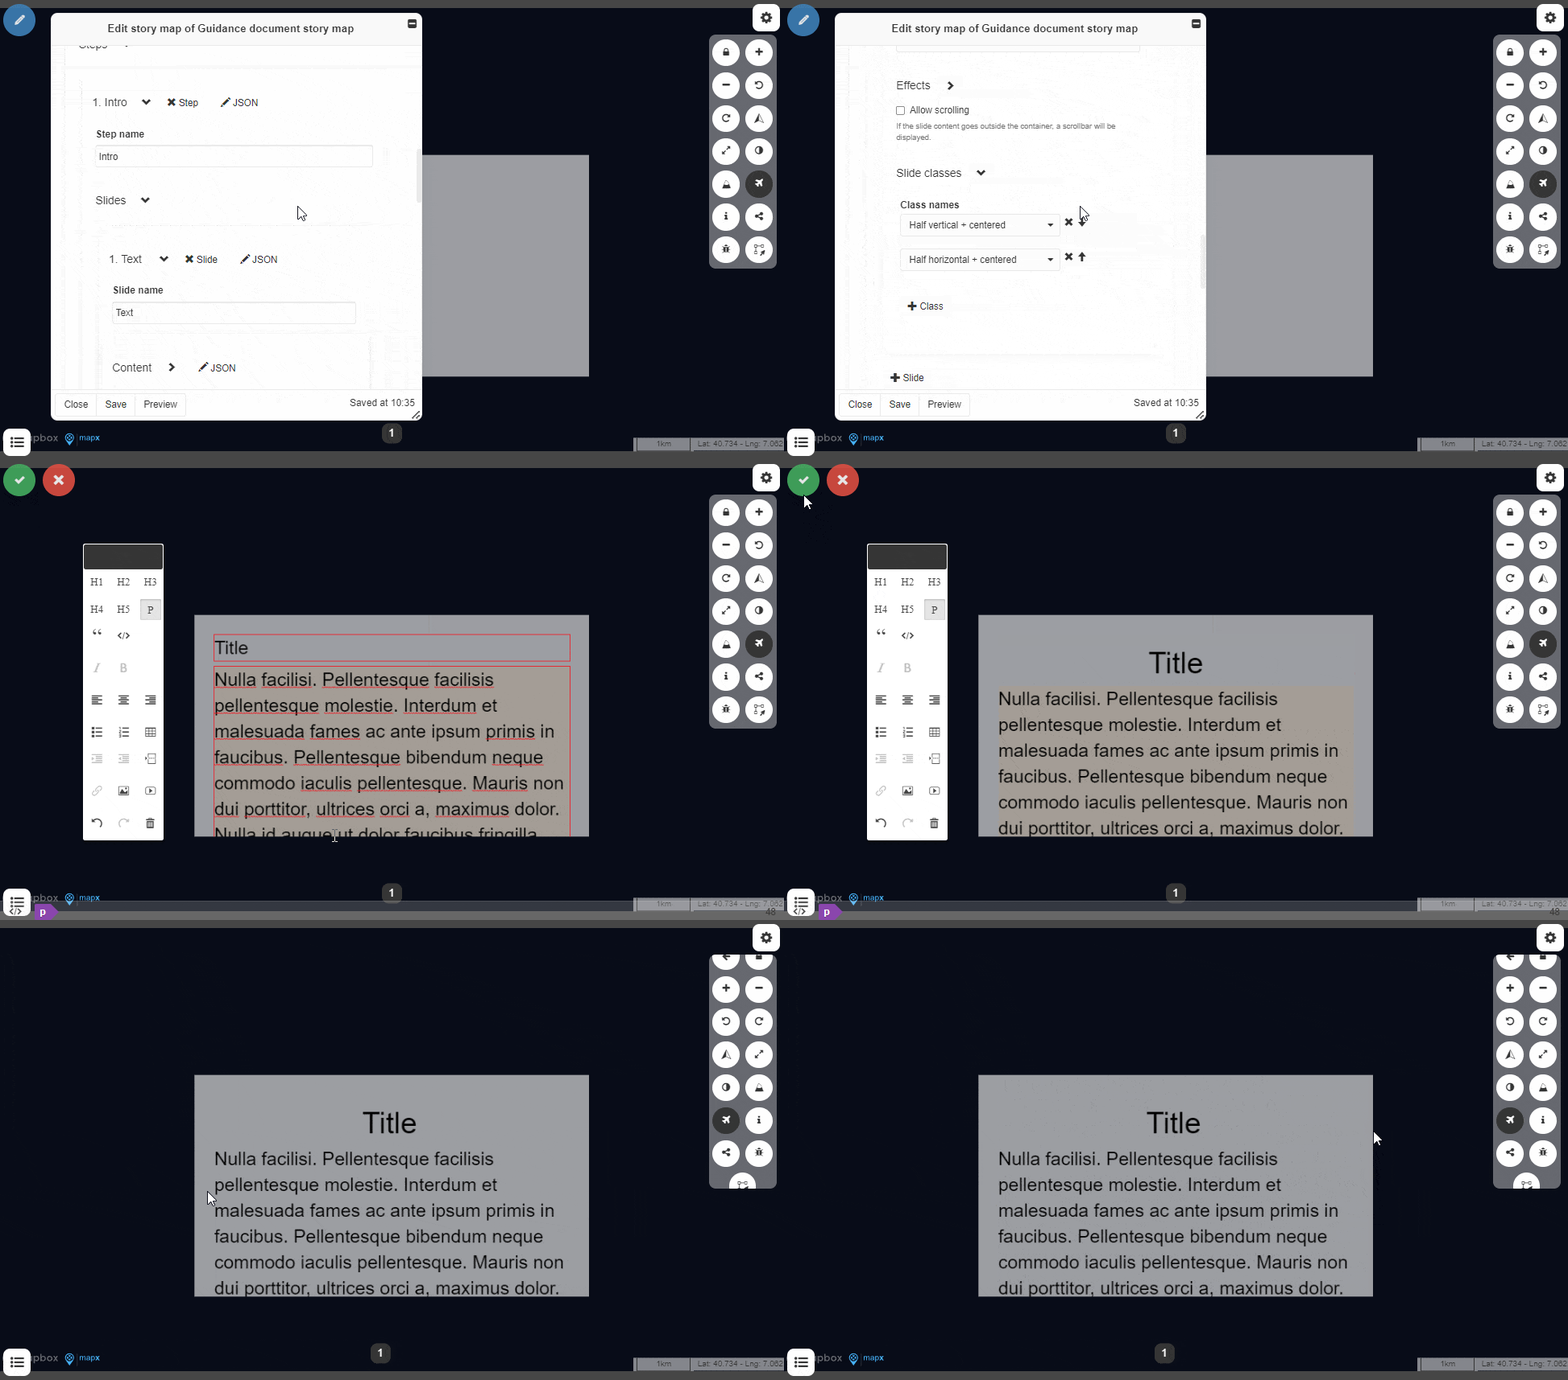
Once the slides are configured, press the Preview button to view your step. To edit the content of the slides in interactive mode, press the pencil button in the top-left corner. You can now click in a slide and add content i.e., text, photos, videos. A panel containing text formatting options and tools for adding images and videos is automatically displayed in the interface as soon as this editing mode is activated.
When done with editing, click on the green button located on the top-left corner of the screen to save all changes or click on the red button to discard them.
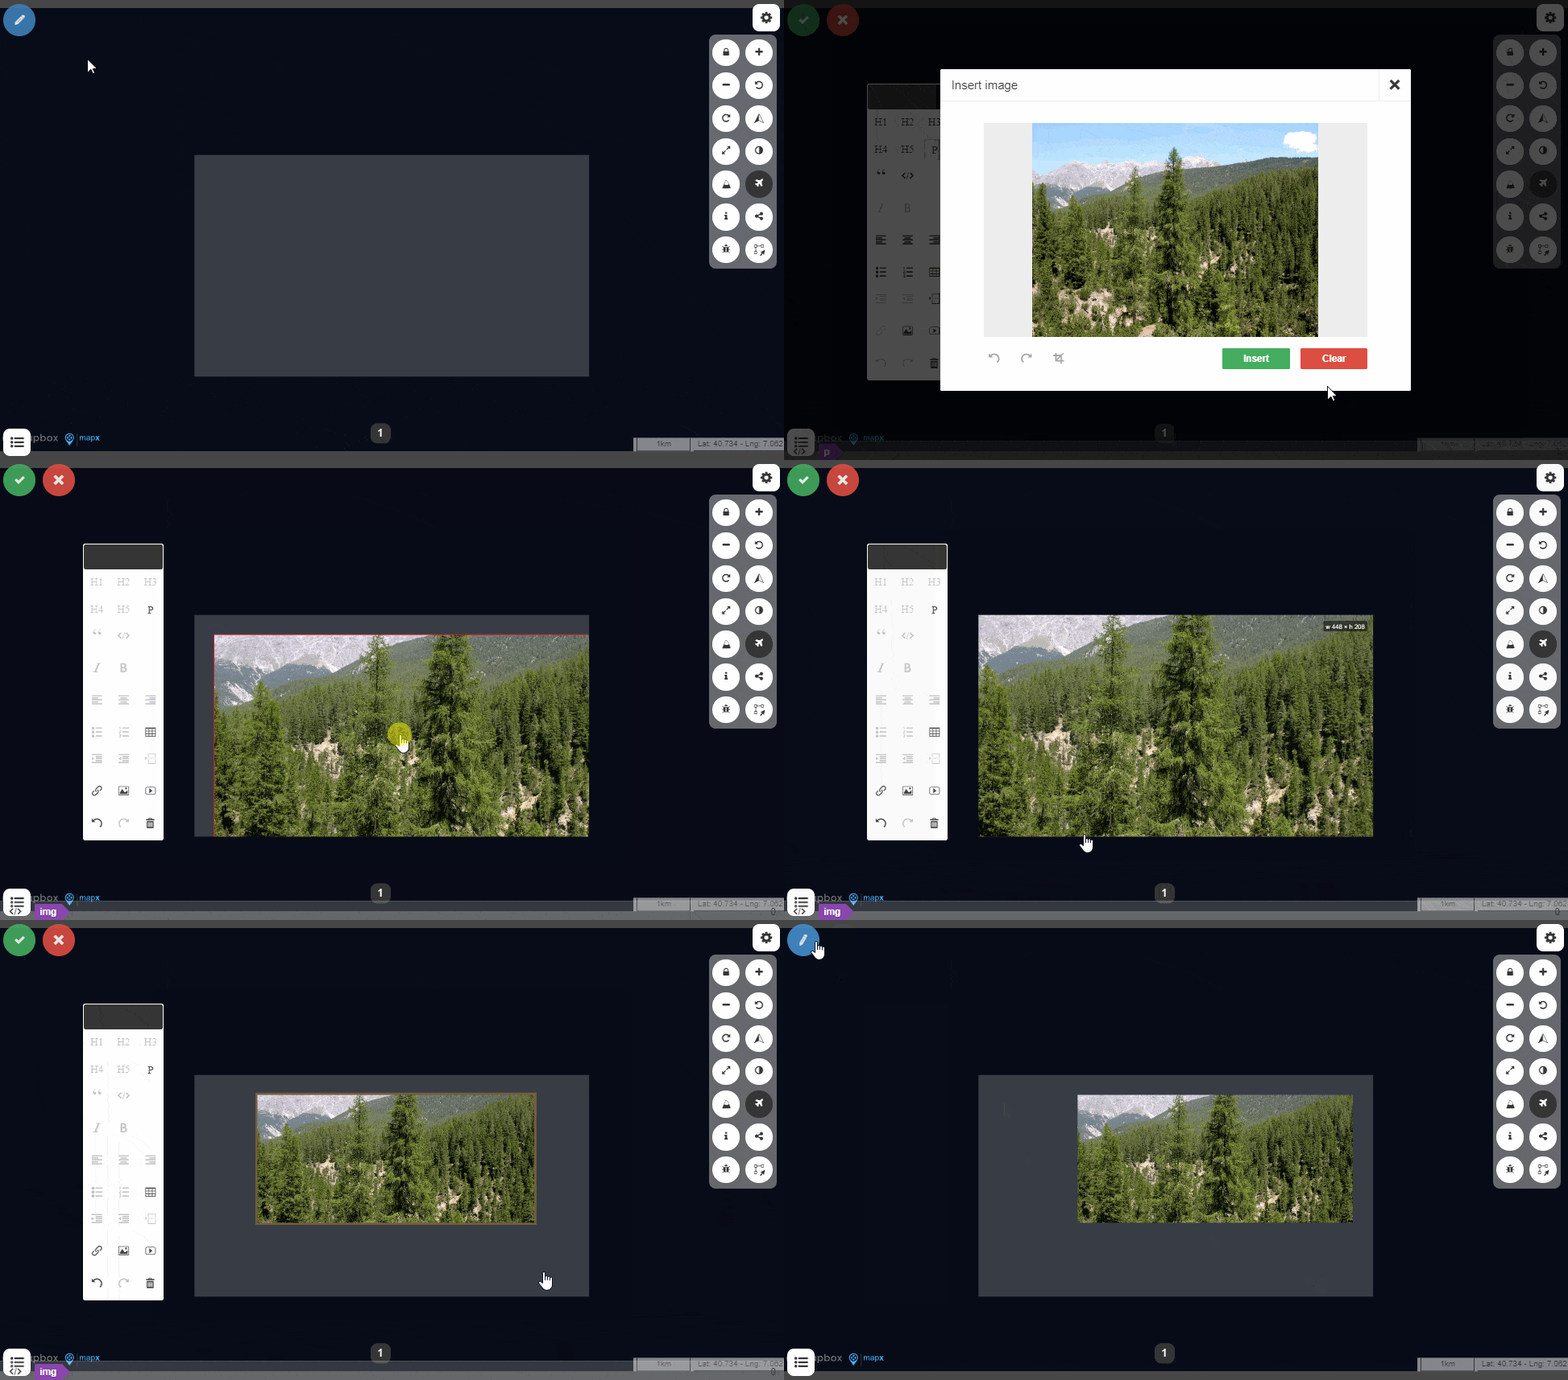
In case an image and/or a video is added in a slide, it can be resized by dragging one of its corners and its positioning can be fine-tuned using additional options by clicking on the “img” or “iframe” button located in the bottom-left corner.
Adding a hyperlink#
You may need to add a hyperlink in your narrative to refer to further information or to cite a data source. To do so, select the text to attach the hyperlink to, and click on the “tie” icon. A text box appears above the highlighted text, paste your link, and click on the green (check) button to save it. If you want the link to open in a new tab (which we recommend), you just have to click on the “external” (circled in purple) button before saving your link.
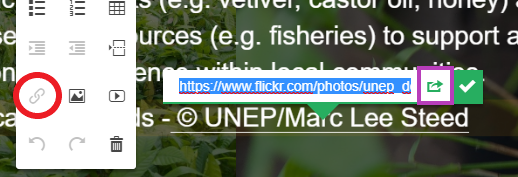
Add a hyperlink#
Activate views#
The Activate views section allows you to enable spatial data (views) to be displayed in the map for a given step. All public views as well as private views for which you have read rights (except for story maps, no inception possible) can be activated in the map. Multiple views can be activated in the same step and if so, they will be organized according to the order defined in the tool (e.g., View 1 being the top layer and the View 2 being the bottom layer).
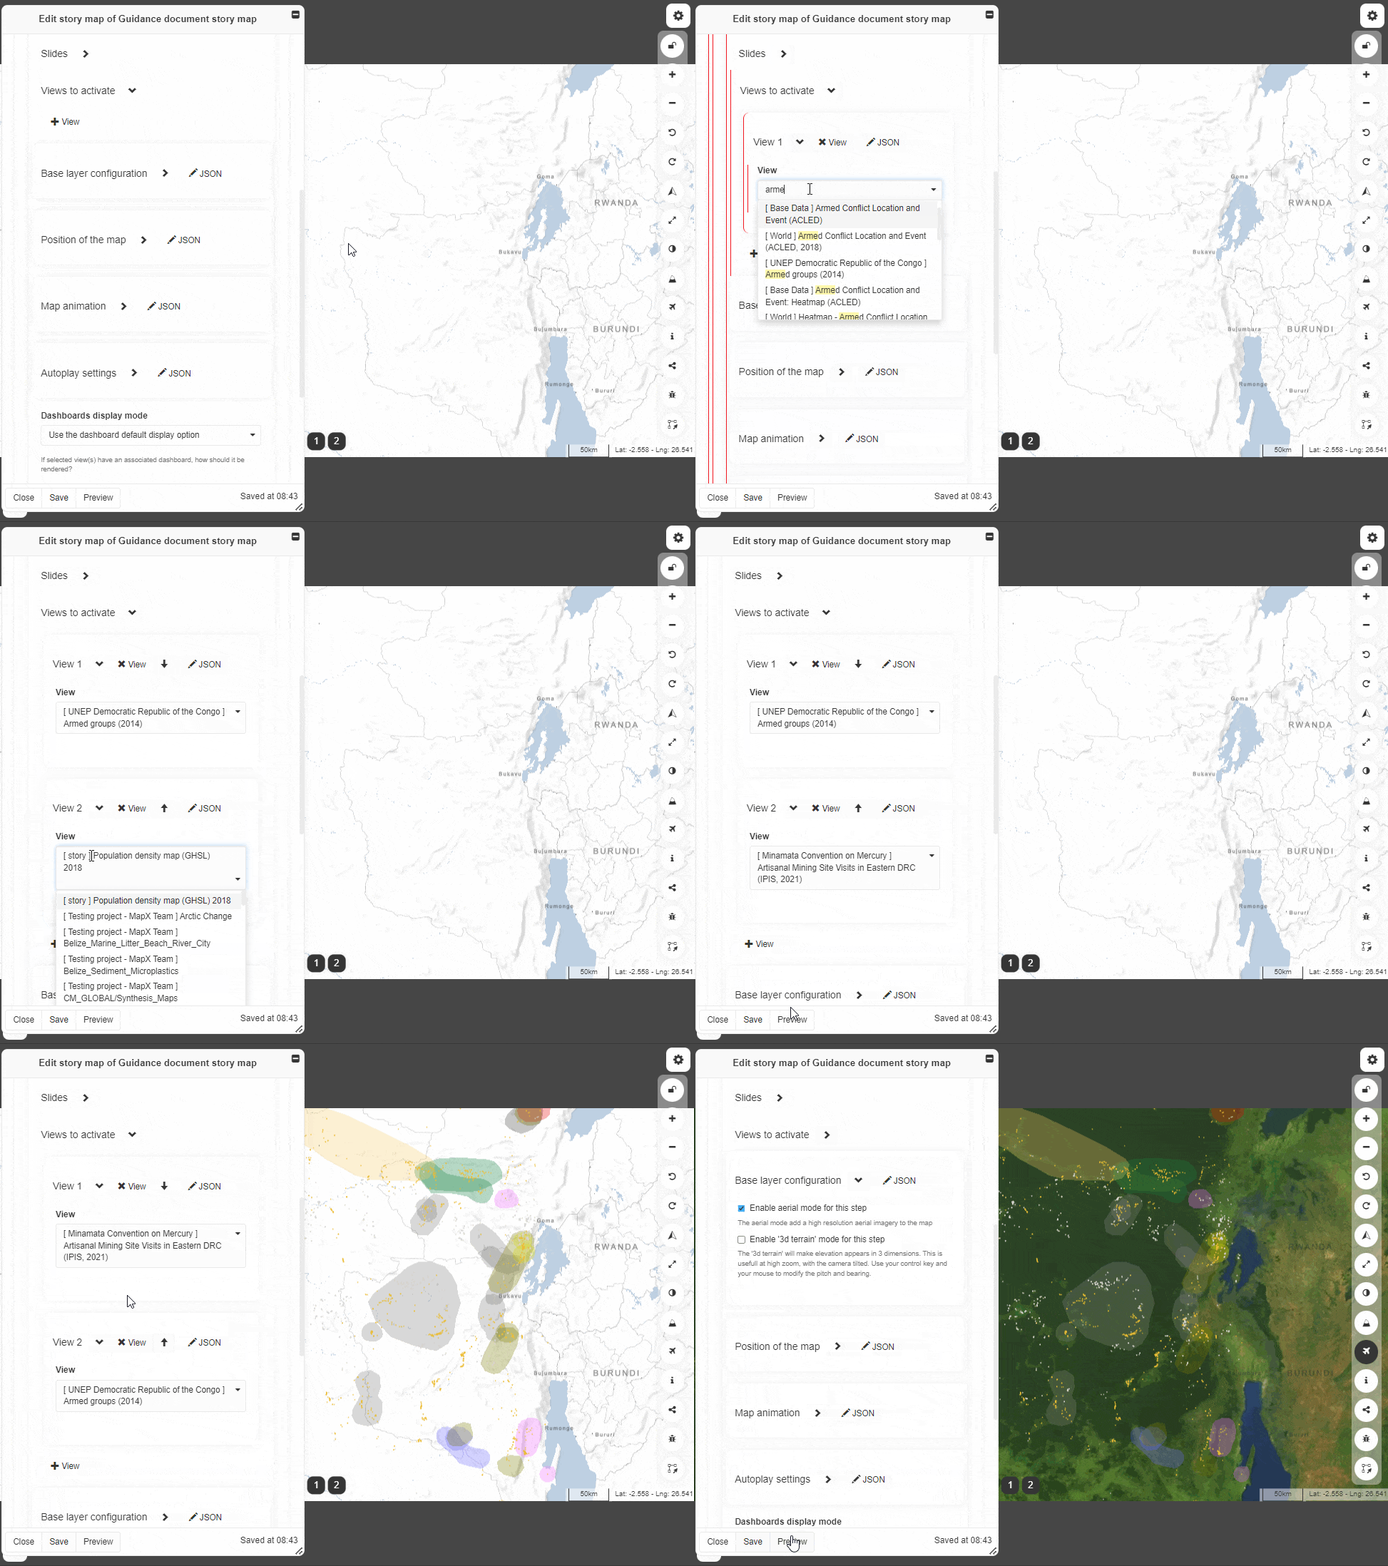
Reminder: if you want to display your data with the aerial mode as basemap, you will have to activate it from the Base layer configuration section.
Position of the map#
By default, the steps cover the entire world which is suitable for the visualization of global data but depending on the subject you are addressing, it may be relevant to show a specific geographic area in the map in your story map. To do so:
Expand the Position of the map section.
Click on the lock button in the menu bar (top-right corner) to unlock the map.
With your mouse, you can now zoom in, zoom out, and move the map as much as you want to select the area of your interest.
Click again on the lock button to lock the map.
Click on the Update using current map parameters to update the geographic coordinates of the map according to the map you see on your screen. The geographic coordinates of your map appear automatically in the text boxes.
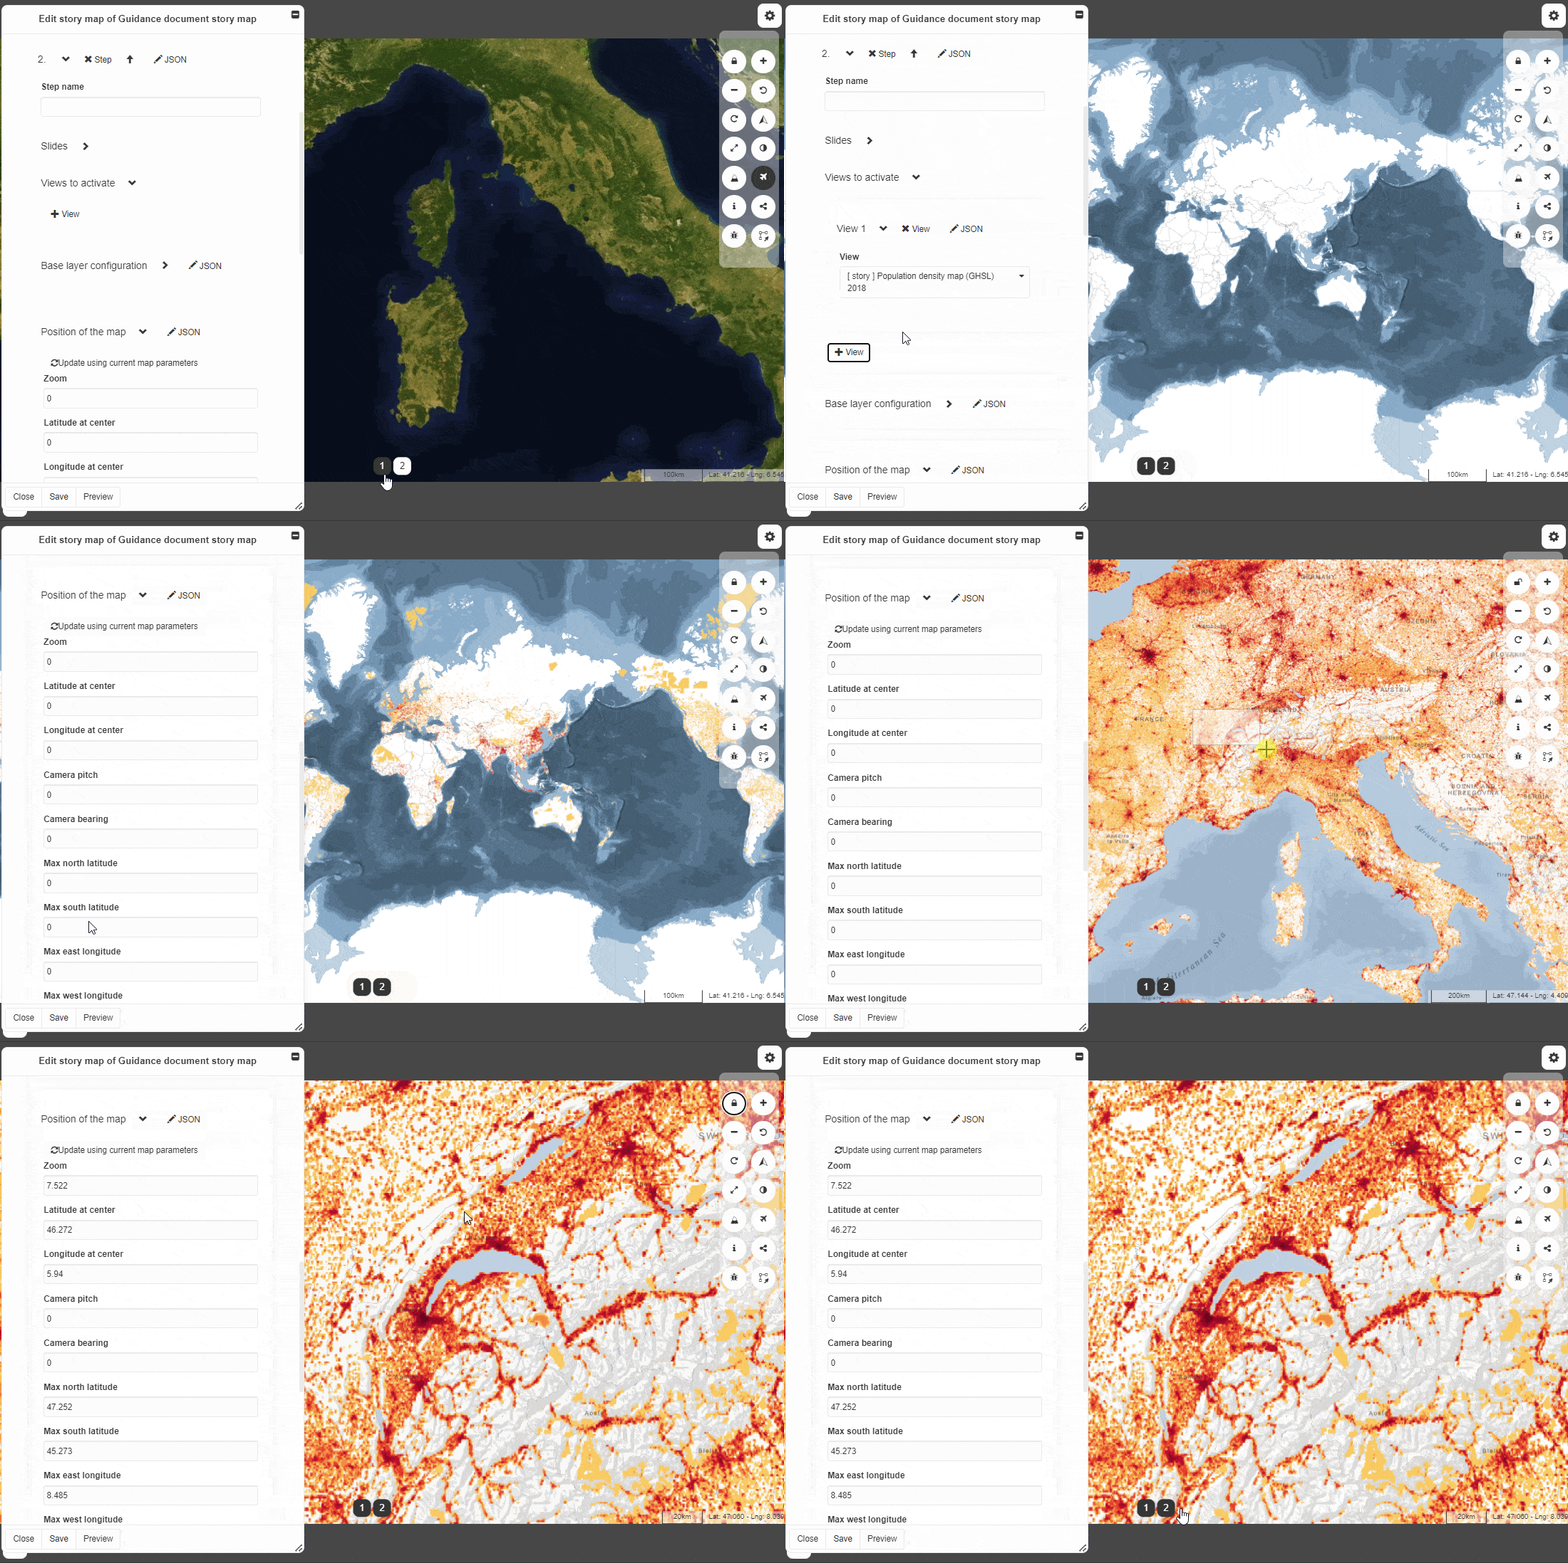
Map animation#
The Map animation section lets you choose the transition from one step to the next in a story map.
Note
The settings provided in this section apply to how you get to the current step. In other words, to customize the transition from the first to the second step, you will need to edit the Map animation settings on Step 2.
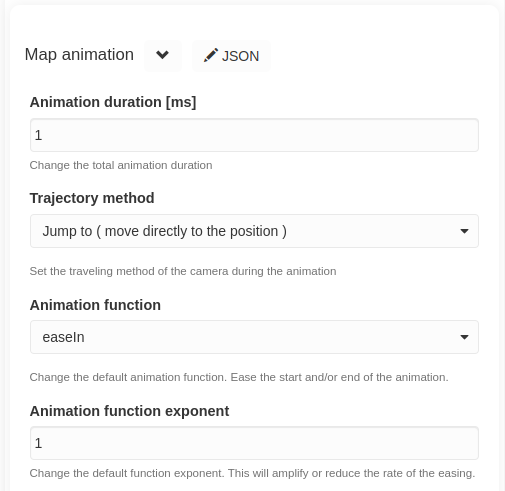
Map animation section#
Animation duration: the time over which the transition spans in millisecond [ms].
Trajectory method: this describes the kind of transition between the steps.
Animation function and Animation function exponent: these are additional settings you can experiment to personalize the map animation of your story map.
